
Hermite tangent planning with dynamic programming for painterly transitions
Summary
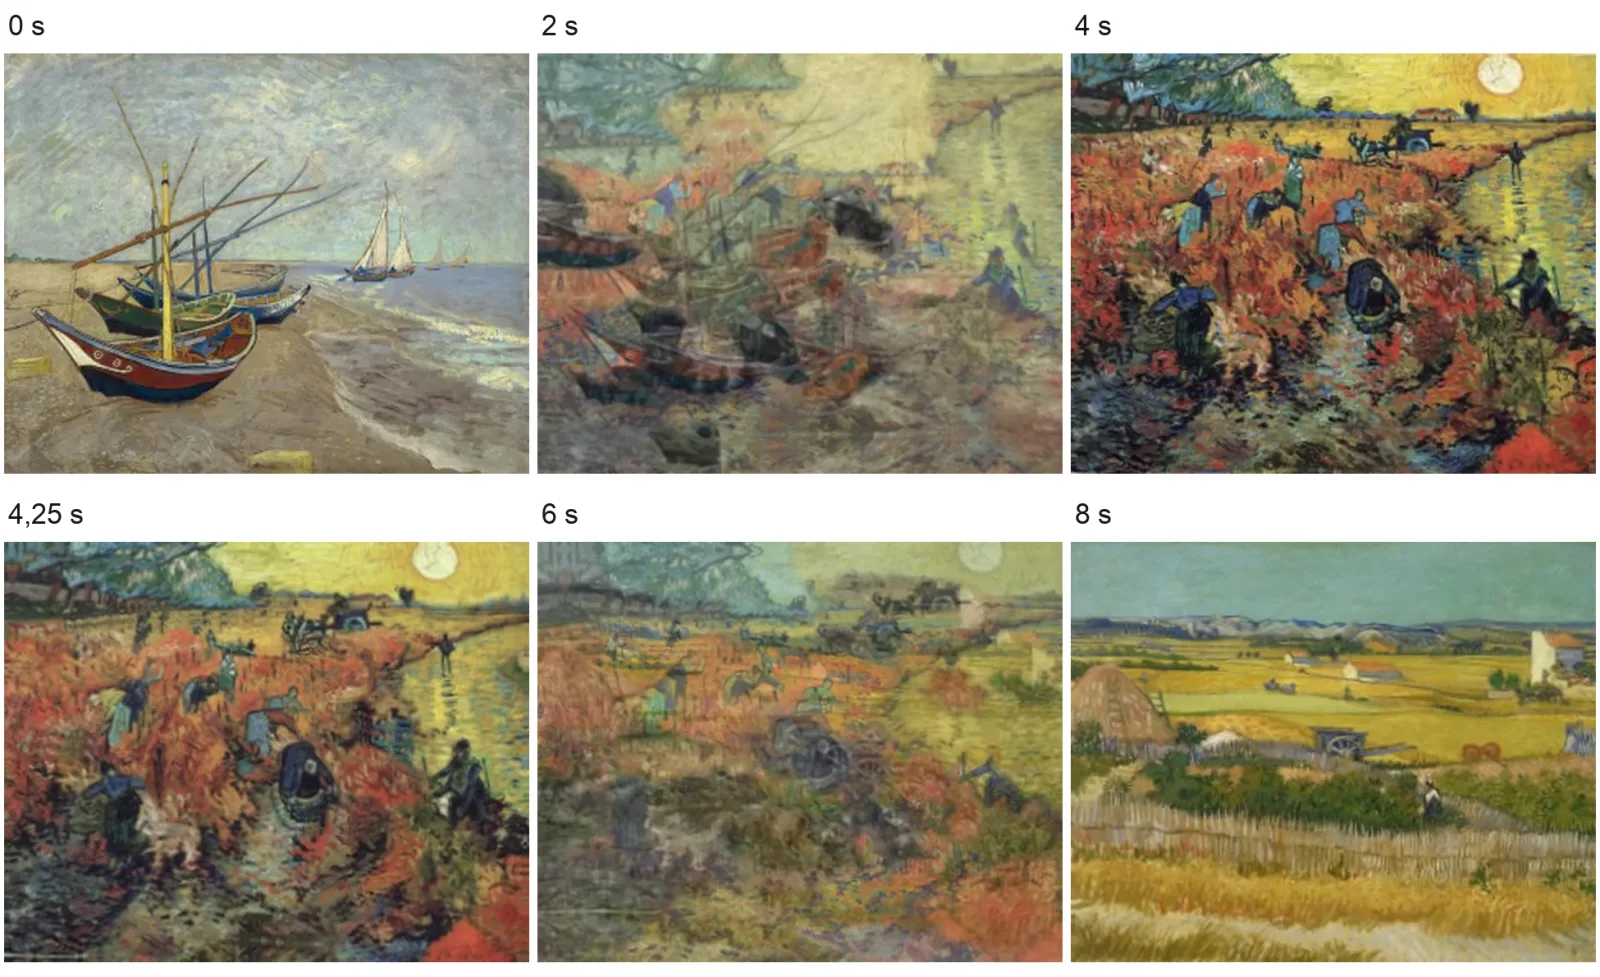
Continuous River animates sequences of paintings. It splits each work into color regions, links them to the regions of the next work and moves each region’s center along a chain of curves that passes through every painting at a fixed time. When crossing a painting, a region can arrive and suddenly turn back: we call it a bounce.
The paper proposes choosing the tangents of those curves jointly, over each region’s whole history, with dynamic programming. We compare it with straight lines, Catmull-Rom, a natural cubic and Kochanek-Bartels with tension tuned by cross-validation, on five series of ten works —Van Gogh, Monet, Hokusai, Cézanne and Pissarro— with everything else fixed.
The method in three steps
- 01Regions and histories
Each painting is split into regions by color and position, and each region is linked to its match in the next work. A history gives one centroid per painting.
- 0227 tangents per point
Each centroid gets nine directions, from −100° to 100°, and three magnitudes. Every pair of consecutive tangents defines a Hermite curve with a cost: maximum turn, uneven progress and extra length.
- 03Dynamic programming
A layered graph, one layer per painting and one state per tangent, picks the sequence with the lowest total cost. That is 7,290 curves evaluated per history and the exact optimum of the graph.
Results
1 of 664
crossings turn more than 90° around the painting, in a ±0.4 s window. Kochanek-Bartels leaves 71; the natural cubic, 95.
| Centripetal Catmull-Rom | 225 | |
|---|---|---|
| Natural cubic | 95 | |
| Kochanek-BartelsT = −1, chosen by cross-validation | 71 | |
| Kochanek-Bartels, best tensionno T between −8 and 1 goes below 21; getting there triples the deviation | 21 | |
| Plannerdynamic programming | 1 |
Bar chart; the table holds the same values.
The average does not change
In mean turn against deviation, the planner falls on the same curve as Kochanek-Bartels as its tension varies: one tension parameter reproduces its average trade-off.
It costs deviation
The maximum deviation from the straight line between centroids is 2.2 to 3.1 % of the diagonal, against 1.6 to 2.1 % for Kochanek-Bartels with T = −1.
It does not win every crossing
Kochanek-Bartels turns less in 62 % of crossings, almost always by a little. The crossings the planner wins by a lot are few, but they are the ones that weigh.
Under the evaluated conditions, the planner reduces large turns. Their relation to perceived bounce remains under investigation.